


Published by: Elise Caradec — Editor specializing in consulting
In the trader's arsenal, double top and double bottom are among the most observed structures. These figures, which draw a « M » or « W » on graphics, translate a psychological exhaustion of buyers or sellers. They often announce a major shift in the trend. Whether you intervene on shares, cryptocurrency or Forex, identifying these configurations and validating their breakout is a technical skill to protect your capital and anticipate flow reversals.
The psychological mechanics of double top and double bottom
Double top and double bottom are turning figures. Unlike continuation models, they indicate that the market has twice failed to cross a technical level, whether it is a support or resistance. This double failure alters the collective psychology: the serode confidence, the profit takings are intensifying and the opposing operators are taking over.
The Double Top: the exhaustion of the peaks
The double top appears after an uptrend. The price reaches a first peak, corrects slightly, then goes up again to test this resistance. The inability to exceed the first peak forms a « M ». This successive rejection proves that buying pressure weakens. The figure is confirmed only after the breakdown of the neckline, the low point between the two summits.
The Double Bottom: the resilience of hollows
Conversely, the double bottom is formed after a downward trend. The price hits a low point, bounces back, then back to that support before going up again. This drawing in « W » shows an area where demand exceeds supply. The purchase signal is triggered by the rupture of the neckline, the intermediate summit. This indicates that the sellers have lost control.
How exactly do I detect these patterns?
Visual identification carries risks of subjectivity. A beginner trader can confuse a simple lateral consolidation with a reversal. To gain rigour, rely on strict geometric and temporal criteria.
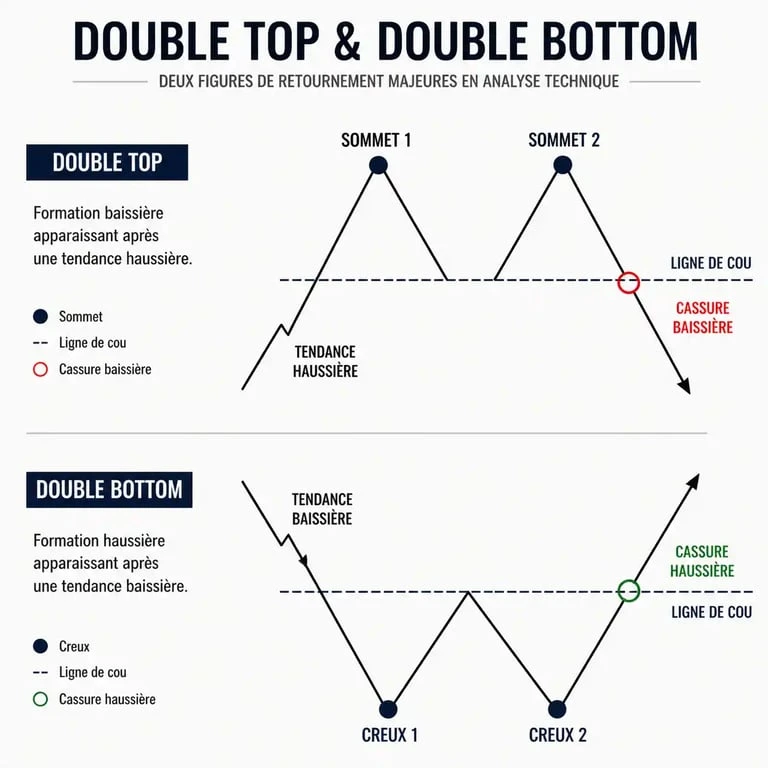
The spacing between the two peaks or hollows is decisive. If the points are too close, it is often a market noise. A significant time difference, measured over several dozen candles, reinforces the validity of the figure. The longer the time separates the two tests, the more the rejection zone is considered to be Technical pillar by institutional algorithms and traders. This structure is used to filter false signals and to retain only high probability rollovers.
Use of volume indicators
The volume confirms the validity of the pattern. During the formation of the second top for a double top, the volume must be lower than that of the first, indicating a lack of interest from buyers. On the other hand, the neckline break must be accompanied by a significant increase in volumes, proving that the market is moving massively in the new direction.
Automation : Screeners and scripts
Many traders use automatic detection tools on platforms such as TradingView or ProRealTime. High and low pivot scripts scan the assets to identify these figures. The key parameters to be monitored are:
The period of analysis (lookback) defines the number of candles scanned, often between 40 and 60. The tolerance threshold accepts a slight price difference between the two summits, as they are never perfectly aligned. Finally, the confirmation of closure is essential: the tool must only validate the figure after a closed candle beyond the neckline.
Trading Strategies: Entry, Exit and Risk Management
The trading of these patterns is based on a golden rule: never anticipate breakout. Entering too soon exposes to traps, such as a triple top transformation or a simple lateral drift.
The entry point and the pullback rule
There are two approaches to entering positions. Aggressive entry occurs as soon as the price closes beyond the neckline, with the risk of suffering « bull trap » or « bear trap ». The conservative entry, recommended, consists of waiting for a pullback. The price comes back to test the old neckline, which changes role to become support or resistance, offering a better ratio of risk to return.
Calculation of goals and placement of Stop Loss
Risk management must be millimetred. To define the profit target, measure the height of the figure, i.e. the distance between the tops and the neck line, then report the distance from the breakpoint. The Stop Loss is usually placed above the two tops for a double top, or below the two bottoms for a double bottom.
| Strategy element | Double Top (Sale) | Double Bottom (Buy) |
|---|---|---|
| Stop Loss | Above the peaks | Below the hollows |
| Entry point | Break or pullback | Break or pullback |
| Objective (TP) | Height carried down | Height carried up |
| Support indicator | RSI downward divergence | RSI upward divergence |
Frequent limits and traps to avoid
The double top and double bottom are not infallible. The market generates deceptive configurations for pressed traders.
The trap of precocity
The classic error is to trade the figure before its validation. As long as the neckline is not crossed, the figure remains theoretical. The price can bounce back on this line and continue the initial trend, transforming the expected turnaround into a simple consolidation.
The importance of time unit
A double top on a chart in 1 minute has a much lower predictive value than in a daily unit. The higher the time unit, the more significant the figure. For a serene trading, correlate your signals: if you identify a double bottom in H4, check that the background trend in Daily does not contrast violently.
False signals of volatility
In economic announcements, prices sometimes draw long wicks that look like peaks, but result from temporary volatility. Always wait for clean candle fences to validate your levels. The addition of moving averages, such as ADM 50 or 200, helps to confirm whether the rollover is part of a long-term dynamic change or is a simple passenger noise.
Success with these figures rests on discipline. By combining visual analysis, volume monitoring and strict risk management, these patterns become effective tools for navigating financial markets.