


Published by: Elise Caradec — Editor specializing in stock exchange
In the technical analysis, few tools are as well known as the Relative Strength Index, or RSI. Created by J. Welles Wilder in 1978, this indicator accompanies traders to measure the internal strength of a price movement. The RSI does not predict the future, but it provides an accurate reading of the speed and magnitude of recent variations to identify whether an asset is in an over-purchase or over-sale area.
Understanding the mechanics of the Relative Strength Index
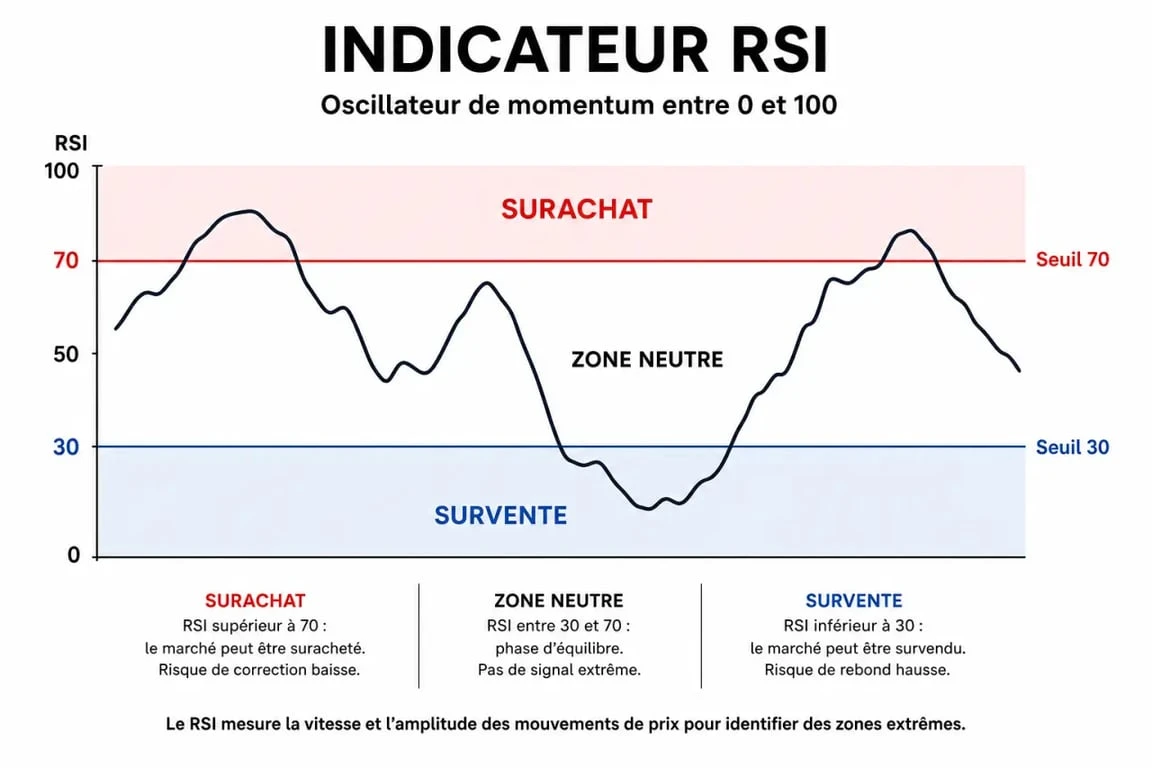
The RSI is a momentum oscillator operating in a fixed range between 0 and 100. It quantifies the power ratio between buyers and sellers over a given period. By default, most trading platforms use a 14-day period, a configuration inherited from Wilder's original work.
The calculation formula
To use this indicator, it is useful to understand its structure. The calculation is based on the relative strength (RS), which is the ratio between the average earnings and the average losses over the chosen period. The formula is as follows:
RSI = 100 - [100 / (1 + RS)]
This mathematical structure smoothes price movements and transforms erratic variations into a fluid curve. The more frequent and significant increases compared to declines, the RSI climbs to 100. Conversely, a dominant salesman makes the indicator plunge into 0.
Tension zones: 70, 30 and the middle line
The interpretation of the ISR is based on specific technical thresholds:
The Overpurchase zone, above 70, suggests that the active has progressed too quickly and that a correction or pause is likely. The Oversales zone, below 30, indicates that the sales pressure was excessive, opening the door to a potential technical rebound. Finally, the line of 50 serves as a trend barometer. An ISR that stays above 50 confirms an upward dynamic, while a crossing below this level marks a take-over by sellers.
Advanced strategies: beyond simple over-purchase
Selling systematically when RSI touches 70 or buying when it touches 30 is a common mistake. In a high-trend market, the RSI can remain in the over-purchase zone for several weeks while the price continues to rise. To turn this indicator into a performance lever, you need to observe more subtle configurations.
Detect divergences
Divergence is a powerful signal. It occurs when the price path and the indicator are separated. Two main types are distinguished.
The Lower divergence appears when the price lists a new top higher than the previous one, but the RSI fails to exceed its own top. This means that the buying energy is exhausted, often announcing a major reversal. In contrast, the Uphill divergence is manifested when the price reaches a new low, while the RSI begins to rise. The market is losing its knock-down strength, suggesting that an accumulation is underway and that a rebound is preparing.
Swing Failure: Confirm Turnaround
The « failure swing » is a graphic figure specific to the RSI. In a downside configuration, the RSI falls into the oversales zone under 30, bounces back, then falls back without breaking its previous low point, before crossing its last rebound peak. This movement « W » on the oscillator is considered by Wilder as a robust confirmation of an imminent change in trend.
The market has a core of stability towards which it tends to return after excess volatility. The RSI acts as an elastic measuring the voltage relative to this centre of gravity. Understanding that the indicator measures the intensity of the momentary imbalance makes it possible to no longer see areas of 70 or 30 as impassable walls, but as energy saturation states where the risk of rupture becomes statistically higher than the potential for pursuit.
Optimize the RSI according to your investor profile
The 14-period standard setting is not an absolute rule. Depending on your time horizon, adjust the sensitivity of the indicator changes the relevance of the received signals.
For the scalping or day tradinga period of 7 to 9 is often preferred for maximum reactivity on micro-movements. The swing trading Generally maintains the standard 14-period setting, providing a balance between noise and signal. For a long term investment, a period of 21-25 is recommended to identify major cycles.
Larry Connors RSI 2 method
For active traders, one variant is to use an RSI over only 2 periods. In this context, the thresholds change: we are looking for overpurchases above 90 and oversales under 10. It is a strategy of return to the aggressive average that aims to capture very short rebounds in a solid background trend.
The traps to avoid and the best combinations
The danger of the RSI is to use it in isolation. On the stock exchange, an indicator alone is an opinion; Two consistent indicators form a strategy. To filter false signals, especially during lateralisation phases, it is imperative to pair it with other tools.
RSI and Medium Mobiles
An effective method is to take only RSI signals that are in line with the background trend dictated by a moving average, such as MM200. If the price is above the MM200, ignore the RSI's over-purchase signals to focus on over-sales signals, which allows you to buy back. This approach avoids shortening a bullish market simply because it seems expensive.
RSI and Volumes
An over-sales zone with trade volumes in sharp increase increases the probability of « climax » seller, often followed by a rebound. If the RSI dives while the volumes are low, it can be a slow drift that could last without offering a quick profit opportunity.
Classic errors during analysis
The costly mistake is to consider over-purchase as a ban on buying. On actions in the middle of the rally, the RSI can stay above 70 as the course progresses sharply. In this scenario, crossing the threshold of 70 confirms an exceptional buying force. Always wait until the RSI recrite the line of 70 down before considering a position exit or short sale.