


Published by: Elise Caradec — Editor specializing in consulting
Optimize sound performance PEA requires a precise knowledge of the risks, costs and tax deadlines specific to this envelope dedicated to share markets Europe. Placement sometimes turbulent, it promises no guaranteed yield, however the long-term averages remain much more attractive than those of Book A or life insurance.
In order to hope to see its capital increase, it is better to select its supports with method, anticipate taxation after 5 years, while preparing periods of decline naturally linked to the movements of financial markets. Some professionals in the sector often point out how much patience is essential during the volatility phases.
Summary of key points
- ✅ The EAP offers annual average returns between 6 and 12% over the long term.
- ✅ The advantageous taxation applies after 5 years of detention.
- ✅ Diversification and patience are essential in the face of market volatility.
PEA: What performance does it really hope for?
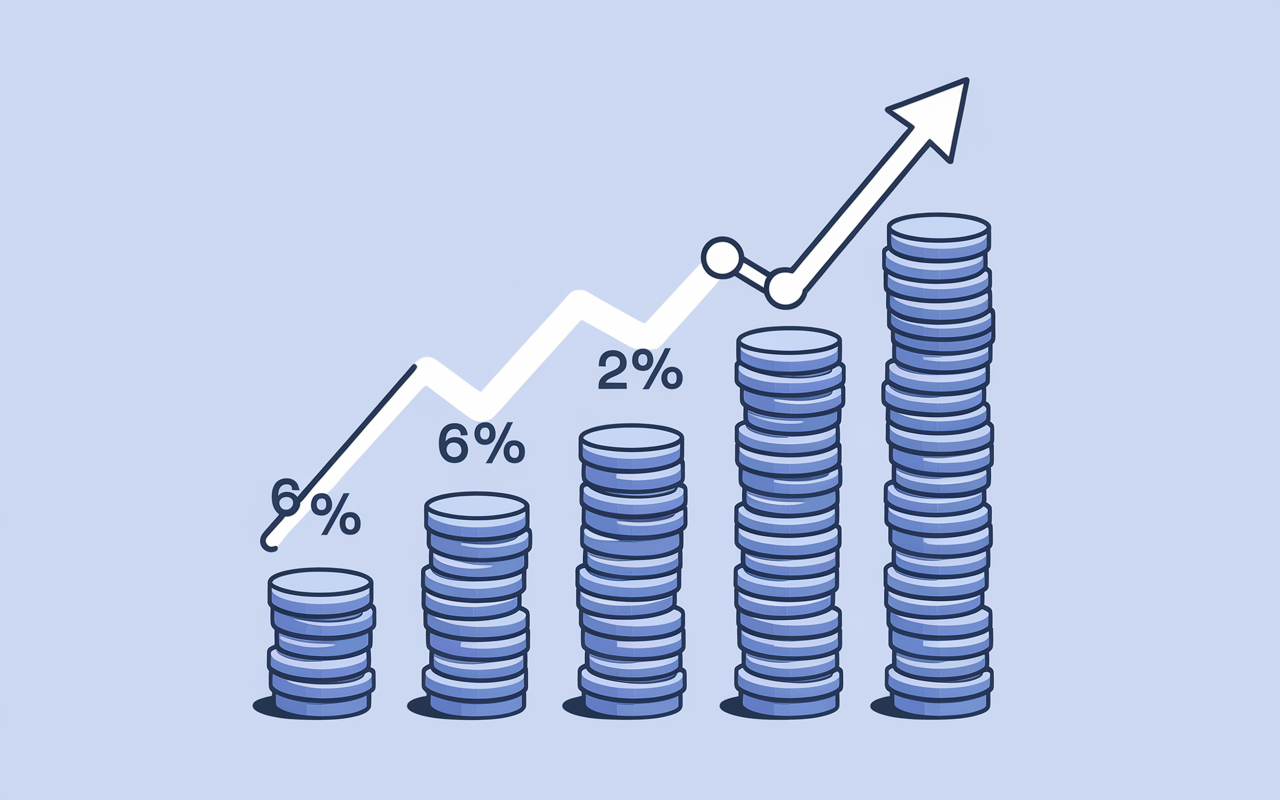
The performance of the EAP varies constantly – it reflects the evolution of European equity markets, influenced by the nature of the instruments, the duration of investment and the impact of taxation. In recent years, the annual average is between 6 and 12 per cent, but capital remains relatively sensitive to stock market fluctuations.
A final point to note: the PEA stands out thanks to its favourable taxation beyond 5 years and allows to invest from 1 €, with a ceiling of 150 000 € for conventional PEA (source Service-public). It is better to have in mind the main mechanisms of performance: gross yield, taxation, costs and risks, to understand in a more concrete way the possible evolution of its EAP.
What is the Equity Savings Plan (EAP)?
The EAP is an investment envelope supervised by the AMF, designed to invest in European shares or eligible funds while benefiting from preferential taxation, provided that the plan is maintained at least 5 years. Various variants exist: the traditional PEA (banking or insurance), the PEA SME-ETI which aims to support the financing of small and medium-sized enterprises, and the PEA young people, intended for the 18-25 years attached to the parental tax home. According to a heritage management trainer, the choice of type of AEP depends heavily on the investor profile.
Opening is possible as soon as 1 €, with a ceiling of 150 000 € for a classic PEA and 225 000 € for an SME-ETI PEA (of which 150 000 € for the classic). A 40-year-old investor who starts with 10 000 € may arrange free or regular payments according to its means.
Practical point: dividends produced on the PEA are systematically reinvested and benefit from the post-5 year tax exemption. For example, some young people already see an accumulation of reinvested earnings on their PEAs as time goes on.
Operation and eligible media
The PEA allows for the encapsulation of eligible European shares, ETFs or funds: the capital is housed in a cash account and then used to acquire assets in different ways (free, managed by a broker or advised). Does pilot management really simplify investment? According to some users, this can reassure at the beginning of the journey.
- Classic PEA: accessible from 1 €, management via bank or insurance, ceiling 150 000 €
- PEA SME-ETI: supplementary, up to 225 000 €, focusing on small and medium-sized enterprises
- PEA young people: ceiling to 20 000 €, similar use but reserved for certain profiles
The difference between PEA banking and PEA insurance is mainly about how to manage its investments: PEA insurance operates via units of account (funds) while PEA banking gives access to securities and ETF directly (an advisor from Banque Populaire often refers to this flexibility with clients).
Management, transfer and security
The EAP can be managed by the saver or by pilot management, with the possibility of transferring to another institution while maintaining fiscal anteriority. The steps of redemption, closing or succession remain framed to preserve your capital.
In some cases, an investor may be reluctant to close his EAP too soon, as taxation is strictly dependent on the length of detention (some experts recommend that they be well informed before any movement).
How is the performance of an AEP calculated?
Performance is derived from the selected assets, holding time and the pace of payments. Unlike Book A, nothing is guaranteed with a PEA: everything evolves according to the market. Over the last 5 to 10 years, the eligible European ETFs have achieved results between 6 and 12 %/year, with sometimes sectoral records at more than 30 % over a year, but also hollows or phases of stagnation.
An asset management consultant stressed the importance of keeping a long-term perspective.
Volatility is real: a prudent investor on low risk choices could target 6 %/year, while a dynamic profile invested 100% on a sector ETF can rely on 12 %, or suffer significant declines.
For example, imagine a placement of 10 000 € to 8 %/year on 10 years : we get 21 589 € outside taxation, according to a simulation widely adopted by market participants. Some customers share their astonishment at the cumulative increase, especially in favourable years.
Gross, net and determining factors
Gross yield corresponds to the performance obtained before levying fees and taxes. Net return includes management fees (often 0.4 %/year),max 0.5 % per transaction), and the tax applicable according to the duration.
Moreover, the investment horizon and asset selection strongly influence the final result.
- Gross return on shares/ETF : in practice 6-12 %/year (historical, unsecured)
- Management costs : average of 0.4 %/year ; Opening costs: 0 to 10 € ; transaction fee: 0.5 % max
- Net performance depends on asset choice, time and ability to limit unnecessary costs
This is also why, over a 10 years, the overall performance regularly exceeds that of a booklet or life insurance, even if years of decline are never to be excluded in equity markets. Nobody has the certainty of a linear progression, but the trend over several decades remains favourable.
Some trainers mention the effect of smart diversification to smooth shocks.
Performance scenarios: prudent, balanced, dynamic
Simulation on 10 000 € invested according to different profiles:
- 6 % over 5 years : you get a sum of about 13 382 € (excluding sampling)
- 8% over 10 years : capital climbs to 21 589 €
- 12% over 15 years : exceeds 54 719 €
These projections illustrate the power of time and the reinvestment of gains. However, an unfavourable year is sometimes enough to make even the most experienced investors hesitate to consult their balance. This reflex is often observed during stock market corrections.
Impact of taxation and fees on net performance
Only after deduction of costs and taxes is its real performance known, the one that actually impacts capital over the long term. PEA taxation remains very advantageous after 5 years : earnings are exempt from income tax but subject to social contributions of 17.2%. Before this threshold, taxation reaches 30 % 12.8% tax + 17.2% social contributions).
This tax scheme is regularly cited by advisors to explain the EAP's profits against an ordinary security account.
Good to know
I recommend that you always check the applicable taxation according to your detention period, as it significantly impacts the net performance of your PEA.
Simulation of net yield, pitfalls & best practices
Example: an investment of 10 000 € to 8 % on 10 years generates 21 589 € excluding fees and taxes. After application of the post-5 year scheme, the net gain remains significant but reduced in 17,2 % on capital gains.
- Opening costs : typically between 0 and 10 €
- Management costs : average to 0.4 %/year
- Transaction costs : until 0.5 per cent in order (ex: Trade Republic invoice 1 €/order, XTB 0 % until 100 000 €)
It is relevant to compare fees between brokers and insurers to maximize net return. Many online comparators exist, and simulators allow to visualize different investment scenarios. One analyst recently mentioned the difficulty of measuring the total impact of fees without a dedicated tool.
Differences between banking PEA and insurance PEA
The banking PEA allows you to manage your own investments, while the PEA insurance is based on a logic of funds and life insurance, with variable fee scales. No support guarantees superior performance: everything depends on choice, costs and management conditions.
Some professionals recommend testing both formulas before committing to the duration.
Comparison of PEA and other investments (book, life insurance, CTO)
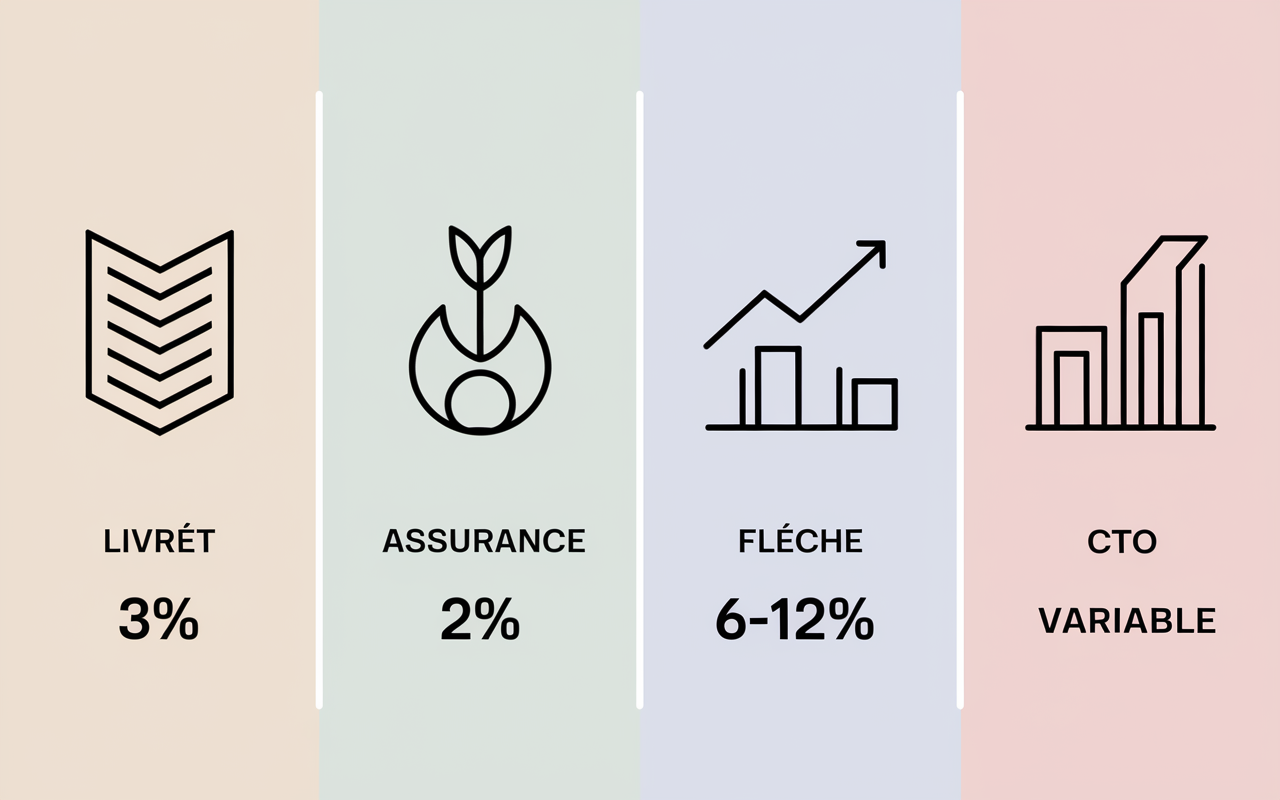
Before taking action, it is worth comparing the EAP with other savings options. Many savers wonder: is this really more interesting than a booklet or life insurance? It is observed that these questions come back regularly during meetings with brokers.
Comparison of yield and safety
Overview of main differences:
| Placement | Annual yield (average) | Taxation | Guaranteed capital? |
|---|---|---|---|
| Book A | 3 % | Exemption: | Yes |
| Life insurance (euro funds) | 2-2,5 % | Tax relief after 8 years | Yes |
| PEA (actions/ETF) | 6–12 %* | Tax exemption after 5 years, 17.2% social contributions | No |
| CTO | Variable (based on assets) | Flat tax 30% | No |
*Performance on some sectoral ETFs can range up to between 35 and 40 %/year, not guaranteed. On average, the capitalisation declared on PEA in France is around 14 600 € (source AMF). Some brokers mention this data in their presentations.
Benefits and limitations of the EAP in relation to alternatives
The EAP has a favourable tax system after 5 years, displays generally higher returns but does not offer guaranteed capital. Book A ensures total security, but its yield does not compensate inflation over time.
Life insurance is valued in succession, especially with Euro funds, but regularly limits to 2-3 % net.
- PEA: strong potential profitability, tax optimised after 5 years, volatility to monitor
- Booklet A: fully protected capital, moderate yield
- CTO: flexibility, but heavy taxation and high risk exposure
- Life insurance: possible trade-off between security (euro funds) and dynamism (units of account)
To "make the difference", it is common to start with a sum of a few thousand euros and to aim for a longer period of more than 8-10 years. This is not a miracle story, but rather a journey of evolution based on time and diversification. Some asset management experts stress the importance of not rushing.
Simulators, examples and FAQs: making good decisions
Online simulators are often offered to test various investment strategies and better identify its risk profile. In concrete terms, most brokers or banks highlight tools that allow them to visualize their projections at 5, 10 or 15 years, according to different scenarios. Sometimes a user discovers that he could have optimized his initial distribution using these tools.
Frequently asked questions, concrete cases and optimization
Some benchmarks for further progress:
- The PEA does not ensure a fixed return: everything depends on the equity market, your horizon and the way it is managed.
- It is usually advisable to wait for more 5 years to benefit from the tax advantage.
- The average observed: between 6 and 12 %/year depending on the media and time (historical, but uninsured).
- In practice, subtract 0.4 % charge/year and 17.2% of social contributions post-5 years to calculate the net.
One of the levers to limit risks remains diversification (shares, FTEs, various sectors), avoiding focusing only on one sector, and adopting patience during market declines. Many investors admit that seeing its capital temporarily decline is never simple, but only time allows for smoothing volatility.
According to fund managers, this cautious approach is the one that is bearing fruit.
Optimize your PEA: support, management, errors to avoid
For novices or prudent profiles, managed or advised management is often reassuring and avoids getting lost in the selection of supports.
Typical mistake? Open an AEP and feed it too little, or give in to panic during the first market declines: progressive, diversified and patient investment is often the most relevant route.
Finally: the PEA presents itself as an efficient tax envelope to boost its savings, without guaranteeing a fixed return. Simulating, comparing and selecting media is the key to successful management.
Dynamic FAQ: Your main questions
Does the PEA deliver guaranteed performance? No, the result depends on your profile, time and market situation.
What average yield can be considered? Historically, between 6 and 12 %/year on ETF/shares, but never insured.
Is the tax benefit net of tax? After 5 years, earnings are exempt from income tax, but subject to social levies (17,2 %).
Is there a risk of loss of capital? Yes, the risk remains, but it is mitigated through diversification and a long horizon.
The essentials to remember and your first tools "to act"
PEA is clearly not a miracle solution. Rather, it is a long-term growth path on the stock exchange. After 5 years, taxation becomes very advantageous, better to monitor fees, and accept the volatility inherent in this type of investment.
It is often recommended that you use guides or simulators to confirm your profile and test the expected performance before you start: the majority of institutions offer free tools to accompany you. It is possible to start with 1 €but it will take progressive capital to hope for a significant change.
In case of doubt, client satisfaction is generally high (e.g. average score of 4,6/5 on more than 3,400 Trustpilot reviews with the institutional guarantees (AMF, Public Service, MAIF, Banque Populaire) that reassure new investors. An AMF advisor regularly specifies the reliability of the legal framework.
Next step: it's best to compare, try a simulator or ask an advisor to refine and customize your placement.